Sunday, December 4, 2022

Size Should Correlate with Profit: for AWS and Alphabet, that is Clear

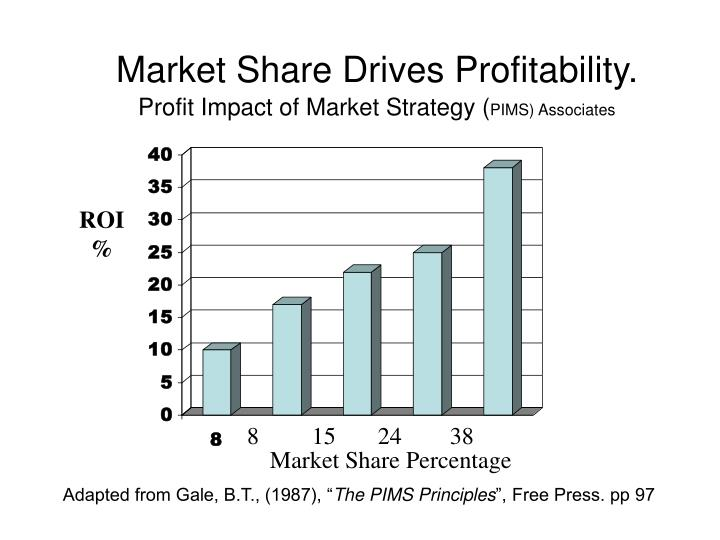
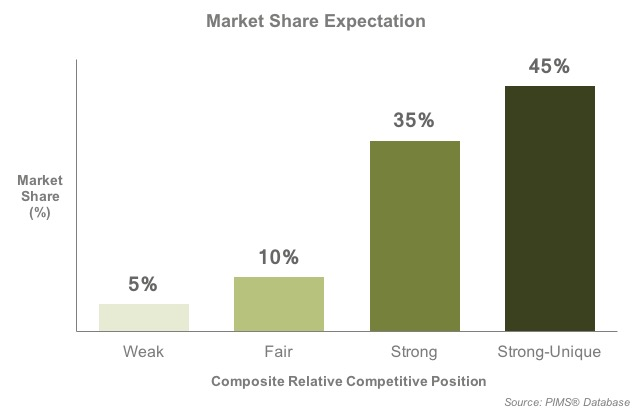
Data center providers with double the share of their closest competitor lead their markets in profitability. The reason is the relationship between market share and profit margin or return on investment.


That is arguably true in the connectivity and data center markets as well, though impossible to verify as Microsoft Azure never releases margin data.  Alphabet profit margins are said to be quite low, in the single-digits range. AWS margins are in the 61 percent range.  
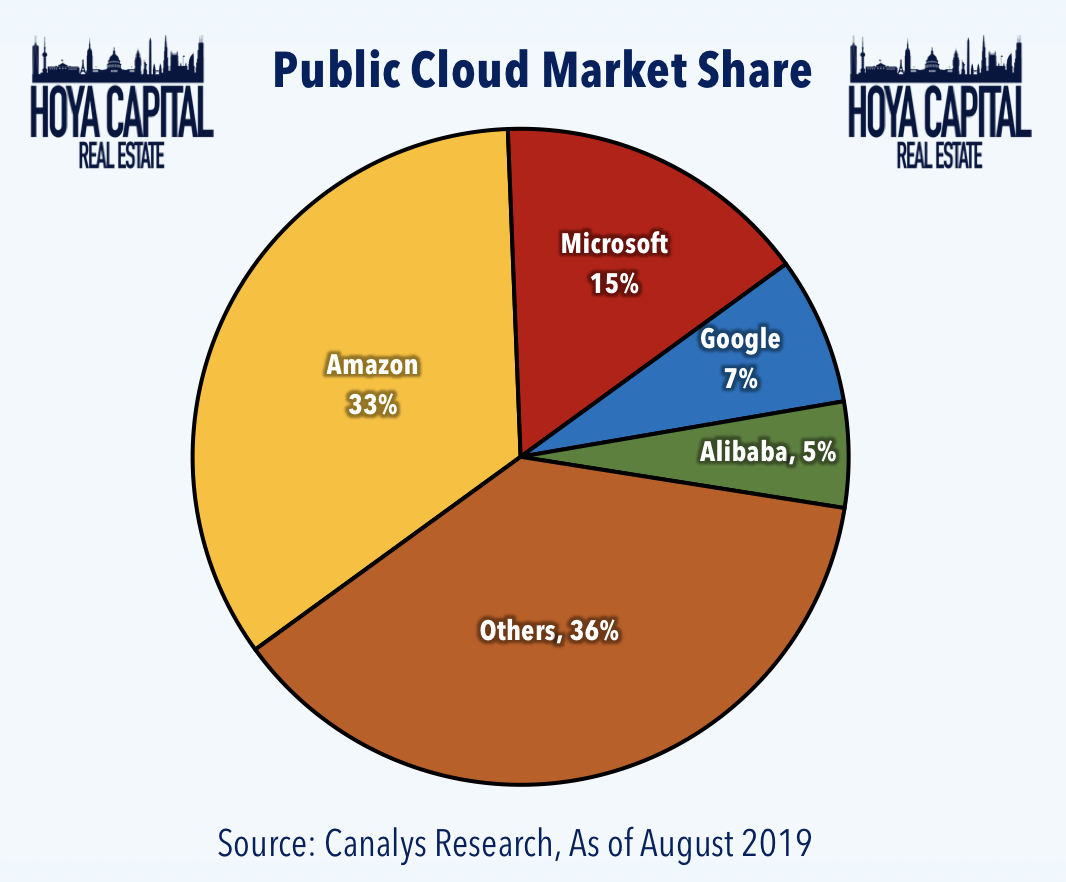

Since Microsoft has never published its profit margins from public cloud services, it is hard to say for certain that the expected pattern holds. 

Profit margin almost always is related to market share or installed base, at least in part because scale advantages can be obtained. Most of us would intuitively suspect that higher share would be correlated with higher profits. 


That is true in the connectivity and data center markets as well. 

source: Harvard Business Review 


But researchers also argue that market share leads to market power that also makes leaders less susceptible to price predation from competitors. There also is an argument that the firms with largest shares also outperform because they have better management talent. PIMS researchers might argue that better management leads to outperformance. Others might argue the outperformance attracts better managers, or at least those perceived to be “better.”


Without a doubt, firms with larger market shares are able to vertically integrate to a greater degree. Apple, Google, Meta and AWS can create their own chipsets, build their own servers, run their own logistics networks. 
source: Slideserve 


The largest firms also have bargaining power over their suppliers. They also may be able to be more efficient with marketing processes and spending. Firms with large share can use mass media more effectively than firms with small share.


Firms with larger share can afford to build specialized sales forces for particular product lines or customers, where smaller firms are less able to do so. Firms with larger share also arguably benefit from brand awareness and preferences that lessen the need to advertise or market as heavily as lesser-known and smaller brands with less share. 


Firms with higher share arguably also are able to develop products with multiple positionings in the market, including premium products with higher sales prices and profit margins. 

source: Contextnet 


That noted, the association between higher share and higher profit is stronger in industries selling products purchased infrequently. The relationship between market share and profit is less strong for firms and industries selling frequently-purchased, lower-value, lower-priced products where the risk of buying alternate brands poses low risk. 


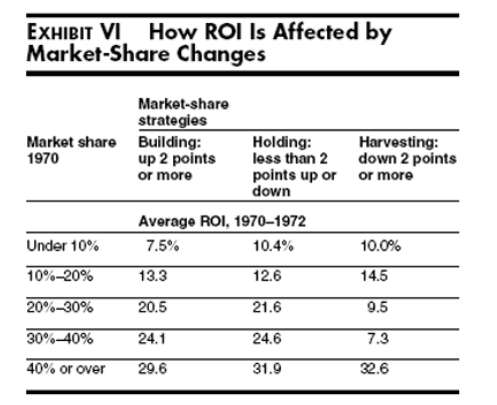
The relationships tend to hold in markets where firms are spending to gain share; where they are mostly focused on keeping share or where they are harvesting products that are late in their product life cycles. 
source: Harvard Business Review 


The adage that nobody gets fired for buying IBM” or Cisco or any other “safe” product in any industry is an example of that phenomenon for high-value, expensive and more mission-critical products. 


For grocery shoppers, house brands provide an example of what probably drives the lower relationship between share and profit for regularly-purchased items. Many such products are actually or nearly commodities where brand value helps, but does not necessarily ensure high profit margins. 


On the other hand, in industries with few buyers--such as national defense products--profit margin can be more compressed than in industries with highly-fragmented buyer bases. 


Studies such as the Profit Impact of Market Strategies (PIMS) have been looking at this for many decades. PIMS is a comprehensive, long-term study of the performance of strategic business units  in thousands of companies in all major industries. 


The PIMS project began at General Electric in the mid-1960s. It was continued at Harvard University in the early 1970s, then was taken over by the Strategic Planning Institute (SPI) in 1975. 


Over time, markets tend to consolidate, and they tend to consolidate because market share is related fairly directly to profitability. 


One rule of thumb some of us use is that the profits earned by a contestant with 40-percent market share is at least double that of a provider with 20-percent share.


And profits earned by a contestant with 20--percent share are at least double the profits of a contestant with 10-percent market share.


This chart shows that for connectivity service providers, market share and profit margin are related. Ignoring market entry issues, the firms with higher share have higher profit margin. Firms with the lowest share have the lowest margins. 

source: Techeconomy  


In facilities-based access markets, there is a reason a rule of thumb is that a contestant must achieve market share of no less than 20 percent to survive. Access is a capital-intensive business with high break-even requirements. 


At 20 percent share, a network is earning revenue from only one in five locations passed. Other competitors are getting the rest. At 40 percent share, a supplier has paying customers at four out of 10 locations passed by the network. 


That allows the high fixed costs to be borne by a vastly-larger number of customers. That, in turn, means significantly lower infrastructure cost per customer.

Saturday, November 26, 2022

How Much "Overinvestment" Danger in Digital Infra?

It has been a couple of decades since we faced systemic risk, major fraud or major overinvestment in what we now call digital infrastructure facilities. Around the turn of the century the issue was overinvestment in data transmission capacity, optical cable networks and  local access networks. 


In the five years after the Telecommunications Act of 1996 went into effect, telecommunications companies invested more than $500 billion in capacity, mostly financed with debt. About $2 billion in market value was lost when the investment bubble popped. 


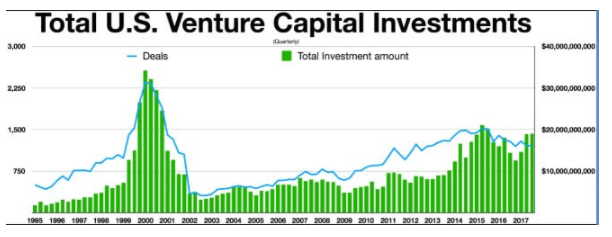
Some argue technology startups are once again in a bubble that is bursting. And though venture capital investment is quite different from private equity, some might worry that PE investment in digital infrastructure is overheated as well. 


There are micro and macro level risks. At the micro level, some firms might wind up overpaying for assets, overinvesting in assets and then finding themselves insolvent. At the macro level, as often happens, we might see the whole infrastructure market flooded with capacity far beyond demand. 


Since nobody is in charge of the whole market, investment booms will tend to overshoot. Eventually, we will have an oversupply of capacity, compared to demand. 


It might be easy to argue that investors are rational, and will not again fall prey to excessive enthusiasm. But greed is a powerful motivator. The fear of missing out appears at times to overrule other considerations. 


On the other hand, some might note, the current valuation reset for venture-funded technology firms is different from 2000-level valuation in part because most of the present venture-funded firms actually have visible revenue models. The issue is valuation, not a viable revenue model. 


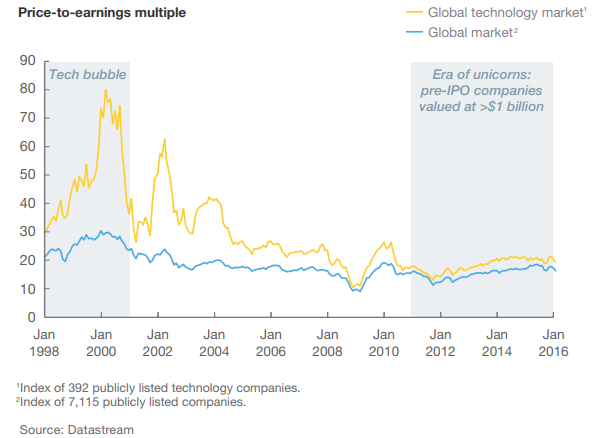
There are public market implications as well. After the 2001 internet bubble burst, firm valuations spent roughly a decade resetting to “rational” levels. 


source: Datastream, McKinsey 


Excessive investment between 1995 and 2001 led to a sharp destruction of wealth, although levels of investment had been on an upturn before the exuberance phase. 

source: Wallstreetmojo


Again, VC investors operate in a different part of the market from private equity or other institutional investors. The point is simply that enthusiasm sometimes can overtake a segment of the market, leading to overinvestment. 


When--and if--that happens in the digital infrastructure market is hard to predict. But some might see increasing levels of threat as valuations climb and low-cost capital availability shrinks. Some later-stage deals might take longer to produce expected profit levels, or produce less profit than originally expected. 


source: Data Center Knowledge


Friday, November 18, 2022

Will Edge Computing Investments by Private Equity Slow?

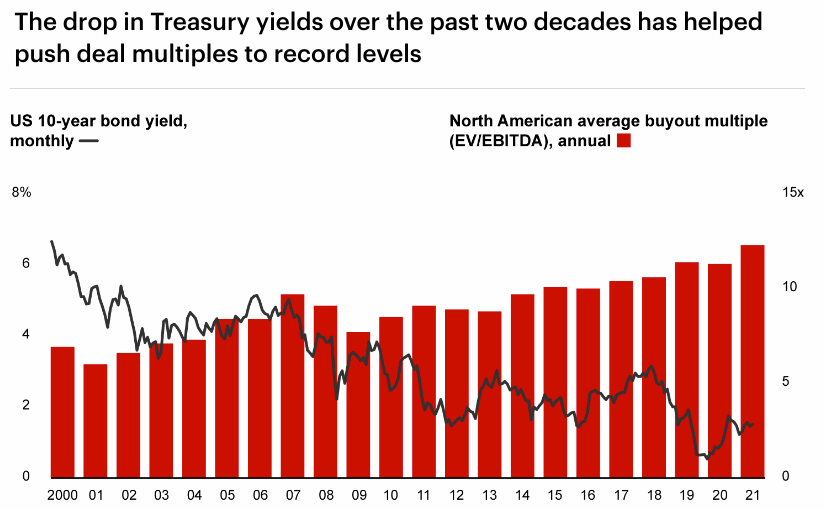
Edge computing infrastructure has been among the beneficiaries of investment by both operators (data centers) and investors (private equity and others). But a climate of rising interest rates will not be so helpful for investors, whose payback models have been built on cheap investment capital. 


Operators are not driven so much by the level of interest rates, but more by the strategic need to support their customers with edge solutions. The level of interest rates matters, but not so much as for investors. 


What we will have to see is the impact on digital infrastructure privatizations in the near term. If interest rates climb to five percent or more, it is going to affect the payback model for taking digital infra (towers, data centers, distribution networks) private.


Low interest rates have meant cheap borrowing costs. All that is going in reverse now, as monetary policy is shifting to higher rates to halt inflation. Higher borrowing costs should slow dealmaking, as payback models get worse. 


source: Bain 


On the other hand, if inflation remains high there are other risks, including severe recession, which likewise would affect deal flow. On the other hand, severe recessions also create buying opportunities for firms with available capital, able to snap up distressed properties. 


So the digital infrastructure investing boom will face new challenges over the next several years, some negative, some perhaps positive. Continued high inflation will mean continued rate increases, a negative. On the other hand, high inflation also can boost asset values, a possible positive. 


Stagflation and recession should slow dealmaking while putting pressure on price multiples. Again, some negative and some positive effects will occur. 


Still, a clear impact might be that the wave of private equity purchases of formerly public infrastructure from service providers would slow, as interest rates rise. 


How much slower is the issue, and for how long. Observers do not expect five-percent (or higher) interest rates for the long term, but activity will hinge on the level of rates and their duration. 


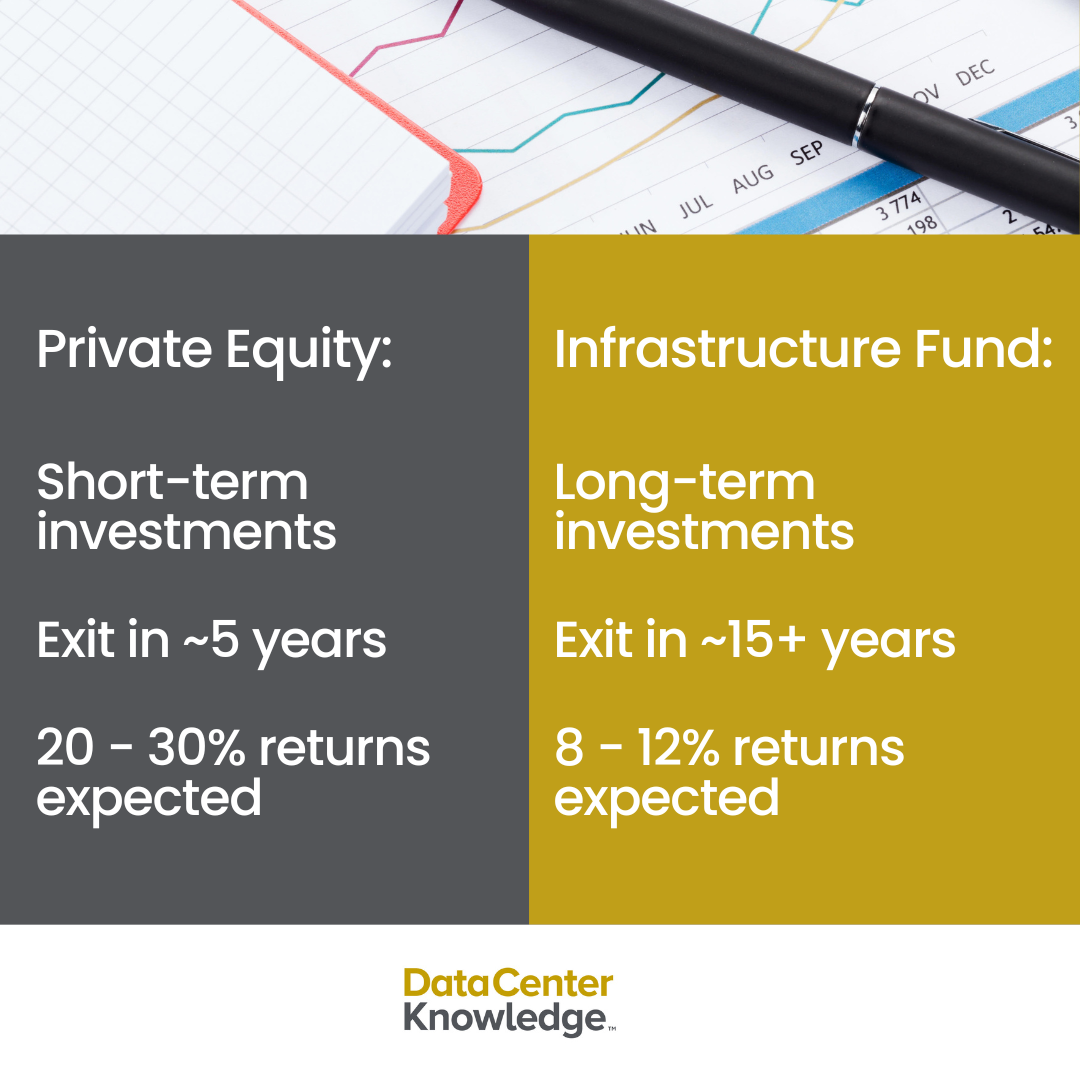
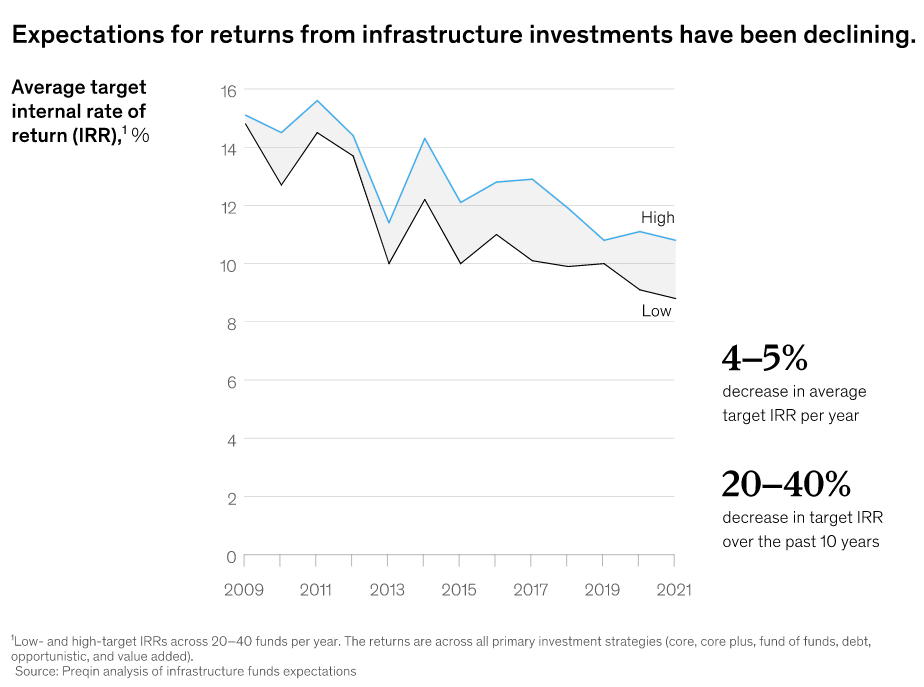
In fact, the whole digital infra privatization business has been fueled by near-zero “real” interest rates. Inflation rates also matter, as they affect “real” interest rates. For the whole class of “alternative” infrastructure (power utilities, roads, airports, oil and gas, renewable energy and data centers, towers and fiber infrastructure), expected returns have been dropping, and specific returns for digital infra might arguably be closer to five percent than 10 percent. 


source: McKinsey 


But that is why five-percent interest rates slow activity. If the expected return is five percent, borrowing costs are five percent and inflation rates are high, investments no longer make sense. 


The point is that it would not be unexpected to see a slowdown in digital infra privatizations for a while. The business case--with higher interest rates--does get worse. 

-----------------------------


Tuesday, November 1, 2022

Recession Fears Haven't Dampened 2023 IT Spending Forecasts

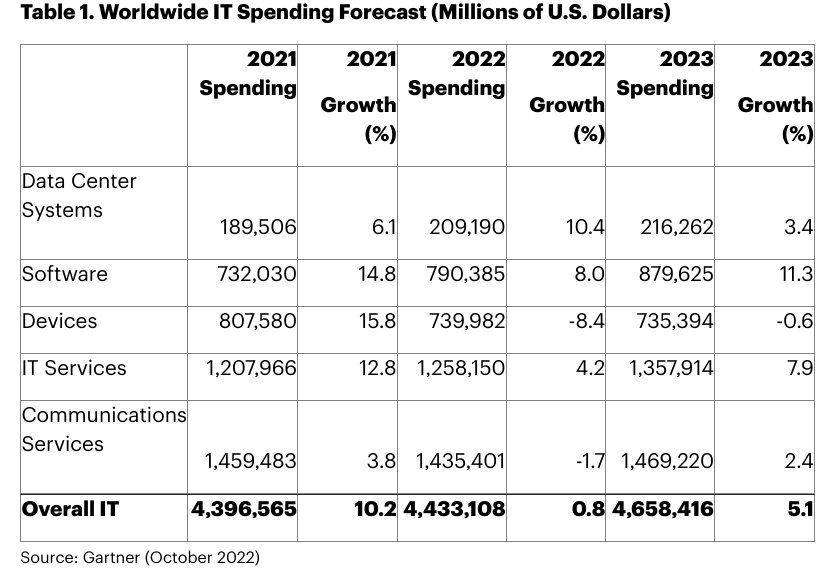
Industry participants rightly worry about the state of enterprise information technology spending whenever there is recession fear. But analysts at Gartner predict worldwide IT spending will grow five percent to $4.6 trillion in 2023, despite the expected economic difficulties. 


All other things being equal, that also should translate into growth of cloud infrastructure services as well. Gartner's “software” category (which includes cloud spending) is expected to rise 11.3 percent in 2023 to reach $880 million. 


source: Gartner


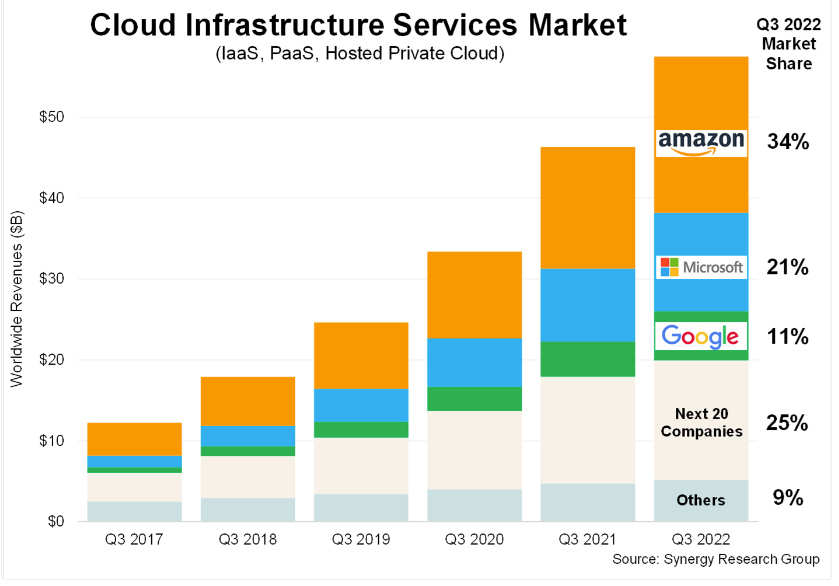
Third quarter 2022  enterprise spending on cloud infrastructure services exceeded $57 billion, says Synergy Research Group.  This was up by well over $11 billion from the third quarter of last year despite a strong U.S. dollar that knocked about six points off the growth rate, and a severely restricted Chinese market, Synergy Research says. 


Still, cloud infrastructure services grew at a 24-percent clip, year over year. 


Google increased its market share in the third quarter, while Amazon and Microsoft market shares remained relatively unchanged. Amazon, Microsoft and Google combined had a 66 percent share of the worldwide market in the quarter, up from 61 percent a year ago, the firm says. 


source: Synergy Research 


“Beyond these three, all other cloud providers in aggregate have been losing around three percentage points of market share per year but are still seeing strong double-digit revenue growth,” said John Dinsdale, Synergy Research Group chief analyst. 


Aside from other considerations, Google’s lower overall market share should sustain its growth rate, as AWS and Microsoft face the law of large numbers, which tends to depress growth rates from a high installed base.

Friday, October 21, 2022

AT&T Deployes Edge Zones

AT&T says it has deployed 5G edge zones in 10 areas, with plans to expand to 12 zones by the end of 2022. Those data centers “will be located…close to cross connect facilities that have fast connections to nearby cloud facilities run by the ‘hyperscaler’ cloud providers,” says Jeremy Legg, AT&T chief technology officer. 


Presumably AT&T is referring to the edge zones it has created using Azure and Google resources. The objective is to bring computing locations closer to where end users are


Undoubtedly the concept is similar to the way AWS and Verizon have created Wavelength zones


source: AWS 

Global Interconnection Bandwidth Growing at 40% Per Year, Says Equinix

Global interconnection bandwidth is forecast to grow at a 40 percent five-year compound annual growth rate,  reaching 27,762 Tbps, which is equivalent to 110 zettabytes of data exchanged annually, according to the Equinix Global Interconnection Index. 


source: Equinix Global Interconnection Report

Thursday, October 20, 2022

Will Edge Computing be Essential for Either Mass-Scale AR or Metaverse in a Decade?

The Telecom Infra Project has formed a group to look at metaverse-ready networks. Whether one accepts the notion of “metaverse” or not, virtually everyone agrees that future experiences will include use of extended, augmented or virtual reality on a wider scale. 


And widespread use of edge computing is likely to be crucial for latency reduction as well as possible limitations on access bandwidth. Fully-immersive and persistent environments will be highly compute-intensive. So local computing is likely to be required for at-scale VR or metaverse use cases.


The metaverse or just AR and VR will deliver immersive experiences that will require better network performance, for both fixed and mobile networks, TIP says. 


And therein lie many questions. If we assume both ultra-high data bandwidth and ultra-low latency for the most-stringent applications, both “computing” and “connectivity” platforms will be adjusted in some ways. 


Present thinking includes more use of edge computing and probably quality-assured bandwidth in some form. But it is not simply a matter of “what” will be required but also “when” resources will be required, and “where?”


As always, any set of performance requirements might be satisfied in a number of ways. What blend of local versus remote computing will work? And how “local” is good enough? What mix of local distribution (Wi-Fi, bluetooth, 5G and other) is feasible? When can--or should--remote resources be invoked? 


And can all that be done relying on Moore’s Law rates of improvement, Edholm’s Law of access bandwidth improvement or Nielsen’s Law of internet access speed? If we must create improvements at faster rates than simply relying on historic rates of improvement, where are the levers to pull?


The issue really is timing. Left to its own internal logic, the headline speed services in most countries will be terabits per second by perhaps 2050. The problem for metaverse or VR experience providers is that they might not be able to wait that long. 


That means the top-end home broadband speed could be 85 Gbps to 100 Gbps by about 2030. 

source: NCTA  


But most consumers will not be buying service at such rates. Perhaps fewer than 10 percent will do so. So what could developers expect as a baseline? 10 Gbps? Or 40 Gbps? And is that sufficient, all other things considered? 


And is access bandwidth the real hurdle? Intel argues that metaverse will require computing resources 1,000 times better than today. Can Moore’s Law rates of improvement supply that degree of improvement? Sure, given enough time. 


As a rough estimate, vastly-improved platforms--beyond the Nielsen’s Law rates of improvement--might be needed within a decade to support widespread use of VR/AR or metaverse use cases, however one wishes to frame the matter. 


Though the average or typical consumer does not buy the “fastest possible” tier of service, the steady growth of headline tier speed since the time of dial-up access is quite linear. 


And the growth trend--50 percent per year speed increases--known as Nielsen’s Law--has operated since the days of dial-up internet access.


The simple question is “if the metaverse requires 1,000 times more computing power than we generally use at present, how do we get there within a decade? Given enough time, the normal increases in computational power and access bandwidth would get us there, of course.


But metaverse or extensive AR and VR might require that the digital infrastructure  foundation already be in place, before apps and environments can be created. 


What that will entail depends on how fast the new infrastructure has to be built. If we are able to upgrade infrastructure roughly on the past timetable, we would expect to see a 1,000-fold improvement in computation support perhaps every couple of decades. 


That assumes we have pulled a number of levers beyond expected advances in processor power, processor architectures and declines in cost per unit of cycle. Network architectures and appliances also have to change. Quite often, so do applications and end user demand. 


The mobile business, for example, has taken about three decades to achieve 1,000 times change in data speeds, for example. We can assume raw compute changes faster, but even then, based strictly on Moore’s Law rates of improvement in computing power alone, it might still require two decades to achieve a 1,000 times change. 


source: Springer 


And that all assumes underlying demand driving the pace of innovation. 


For digital infrastructure, a 1,000-fold increase in supplied computing capability might well require any number of changes. Chip density probably has to change in different ways. More use of application-specific processors seems likely. 


A revamping of cloud computing architecture towards the edge, to minimize latency, is almost certainly required. 


Rack density likely must change as well, as it is hard to envision a 1,000-fold increase in rack real estate over the next couple of decades. Nor does it seem likely that cooling and power requirements can simply scale linearly by 1,000 times. 


So the timing of capital investment in excess of current requirements is really the issue. How soon? How Much? What Type?


The issue is how and when to accelerate rates of improvement? Can widespread use of AR/VR or metaverse happen if we must wait two decades for the platform to be built?

Thursday, October 6, 2022

Ofcom to Study Cloud Computing Market Structure

Cloud computing market concentration is something Ofcom says it will study. The obvious issue is market power. In the U.S., U.K., Europe markets, for example, a few hyperscale cloud services providers dominate. Just three firms generate about 81 percent of cloud computing “as a service” revenues in the United Kingdom, for example. 


source: Ofcom 


Beyond that, Ofcom also will examine other digital markets, including online personal communication apps and devices for accessing audiovisual content. Among the issues Ofcom says it will explore are the ways services such as WhatsApp, FaceTime and Zoom are affecting the role of traditional calling and messaging, and how competition and innovation in these markets may evolve over the coming years. 


Beyond the obvious fact that communications and computing are scale-dependent businesses, there also are industrial policy considerations. Many in Europe are worried that the continent has “fallen behind” the United States and China in global innovation related to applications and computing. 


So efforts to address market competition will tend to take measures that increase the likelihood that local suppliers can win market share. The long-term outcomes are anything but assured. 


Winners in scale businesses, by definition, have scale. In the case of the cloud computing business, that advantage tends to be global in nature. Government policy aimed at restricting the growth of market leaders can provide some breathing room for local competitors. 


Still, in the end, if global scale really does matter, it will always be hard for local contestants to create such global scale. It is not impossible; merely hard. 


And to a greater extent than competition authorities might like to acknowledge, eventual emergence of scale competitors often requires other scale competitors to enter a market. 


Pro-competition policies designed to support new entrants can stimulate market entry, up to a point. Long term significant market share gains often happen only when local firms partner with, or are acquired by, other firms with existing scale. 


Fostering competition often is a compelling policy goal. But it is frighteningly difficult to achieve, in terms of market share outcomes. On the other hand, such policies almost always allow smaller firms to gain scale that such firms ultimately monetize by exiting the market, as part of a sale to other larger contestants. 


So even when policies to promote competition essentially fail at disrupting market structure, such policies often provide many opportunities for new entrants and smaller firms to monetize those opportunities.


Saturday, October 1, 2022

Digital Infra Acqusitions by Private Equity Grow

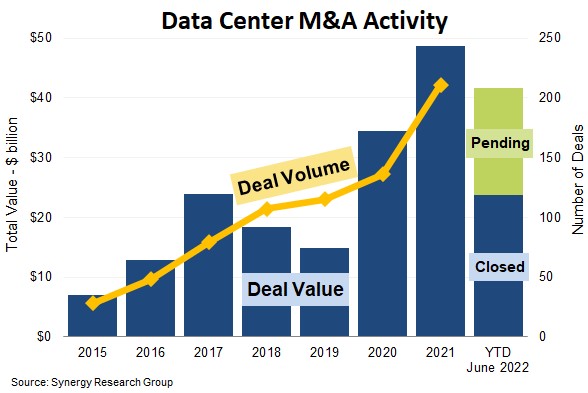
Synergy Research Group says 87 data center mergers or acquisitions happened in the first six months of 2022,  with an aggregate value of $24 billion. 


Some $18 billion of deals are pending. 


Synergy logged 209 deals that closed in 2021 with an aggregate value of over $48 billion.  A notable trend in the industry has been the recent influx of private funds.


From 2015 to 2018, private equity buyers accounted for 42 percent of deal value. In 2019 to 2021, private equity share of the total deal value increased to 65 percent, while in the first half of 2022 private equity share has jumped to over 90 percent, Synergy Research notes. DC MandA June 2022

source: Synergy Research 


Dealmaking has been led by a few big transactions, including the $15 billion acquisition of CyrusOne by investment firms KKR and Global Investment Partners, and the pending acquisition of Switch by DigitalBridge for $11 billion. In 2021 the acquisitions of CoreSite and QTS, each for around $10 billion, were the big transactions. 


Prior to these four transactions, the biggest data center deals were Digital Realty’s $8.4 billion acquisition of Interxion, Digital Realty’s $7.6 billion acquisition of DuPont Fabros, the Equinix acquisition of Telecity for $3.8 billion, the Equinix acquisition of Verizon’s data centers for $3.6 billion and the acquisition of Global Switch by the Jiangsu Shagang Group of China.


Apart from these mega deals, some of the most notable serial acquirers have been Equinix, Digital Realty, EQT, DigitalBridge/Vantage, CyrusOne, GDS, GI Partners, Keppel, Macquarie, Mapletree and NTT, Synergy says. 


Data Center Colocation Market Remains Fragmented

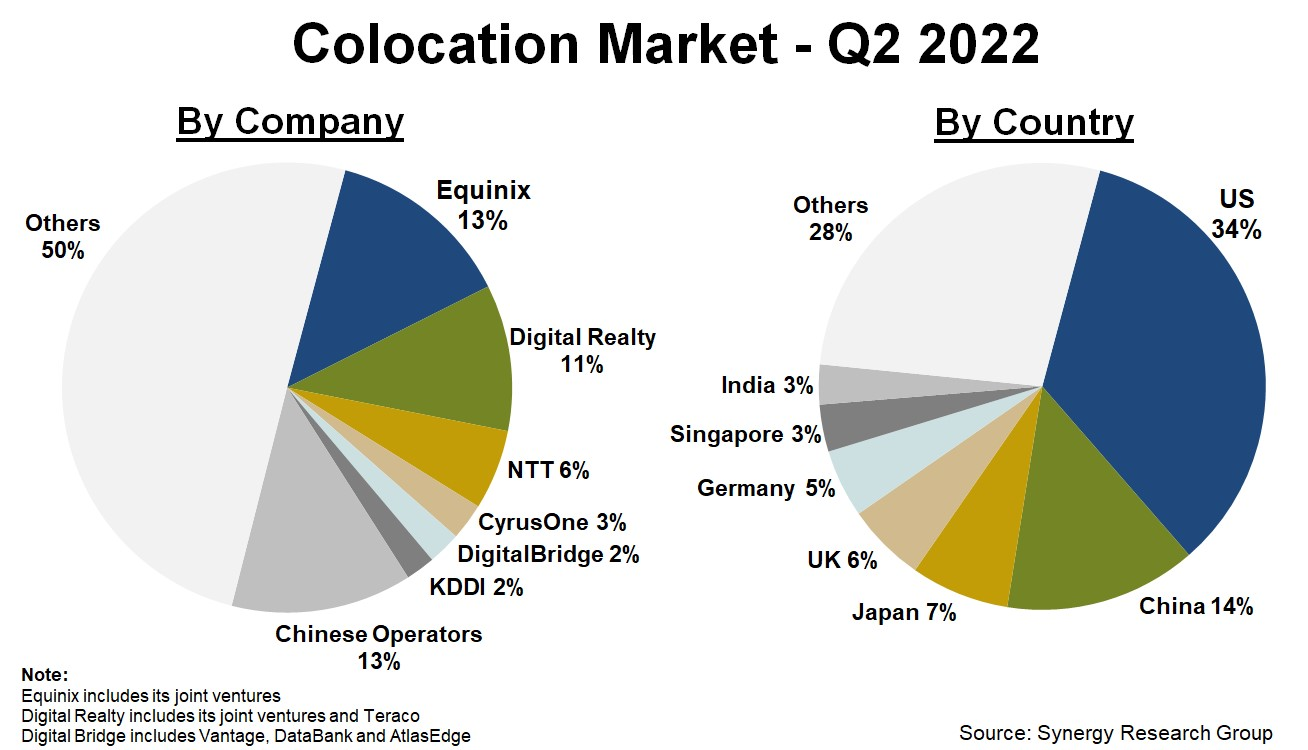
The data center colocation market remains fragmented globally, Synergy Research Group suggests, even if the six leading colocation providers account for 37 percent of the worldwide market. 


Chinese operators have 13 percent share, “thanks to virtually controlling their home market,” Synergy Research says, leaving half the market contestable by a wide range of suppliers.


The market is led by Equinix, Digital Realty and NTT that have about 30 percent of all colocation revenues. 


CyrusOne, DigitalBridge and KDDI have single-digit shares. 


The largest of the Chinese operators are China Telecom, GDS and VNET, according to Synergy. 


Smaller operators with high growth rates include STACK Infrastructure, Mapletree, Chindata, Iron Mountain, Switch and H5 Data Centers. 


The United States and China account for almost half of the world market. They are followed by Japan, UK, Germany, Singapore and India, which together represent another 24 percent of the total. 


The large country markets with the highest growth rates are China, Brazil, India and Singapore.

source: Synergy Research